Research
In figure below typical pump-probe experimental setup for ultrafast transient absorption measurements is shown. Introduction of time delay between the probe and the pump pulse is based on Michelson interferometer setup. Using the two-beam method, a few algorithms of data acquisition can be applied with the most common being a relative normalization of the spectral intensity of the signal to the spectral intensity of the reference. Here, the probe beam is split into two beams: probe and reference. A synchronized optical chopper or optical shutter can be inserted into the pump beam path in order to record probe spectra that are classified as pumped (on) and not-pumped (off) spectra, thereby reducing background effects. Every spectrum is recorded many times and the average spectrum is used in further data processing. For each pump pulse, spectral intensities of the signal and the reference without any excitation in the sample, Ioff probe and Ioff ref , respectively, and Ion probe and Ion ref in the presence of the pump are measured.
Simplified scheme of our experimental setup for transient absorption using THG pump beam at 267nm.
Then the ΔOD of the transient absorption (for a given time delay) can be calculated from the following formula:

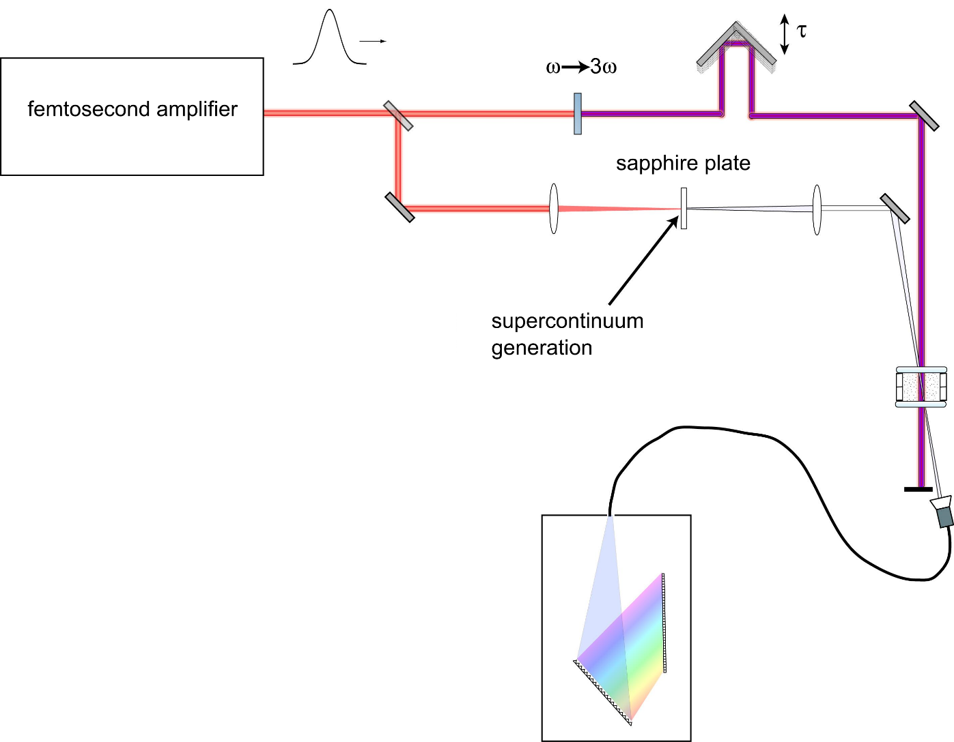
We have built our first version of non-collinear optical parametric amplifier (NOPA) using a sapphire plate for supercontinuum generation. Unlike collinear optical parametric amlifiers (OPAs), NOPAs are capable of producing shorter pulses compared to input pulse. It is also possible to tune the central wavelength of the pulse in a broad range of wavelengths that gives the flexibility in selecting the excitation energy in pump-probe type of experiments. This flexibility is particularly important for the analysis of influence of excitation energy on the observed dynamics. In addition, it also enables excitation of different molecular systems according to their stationary absorption spectra.
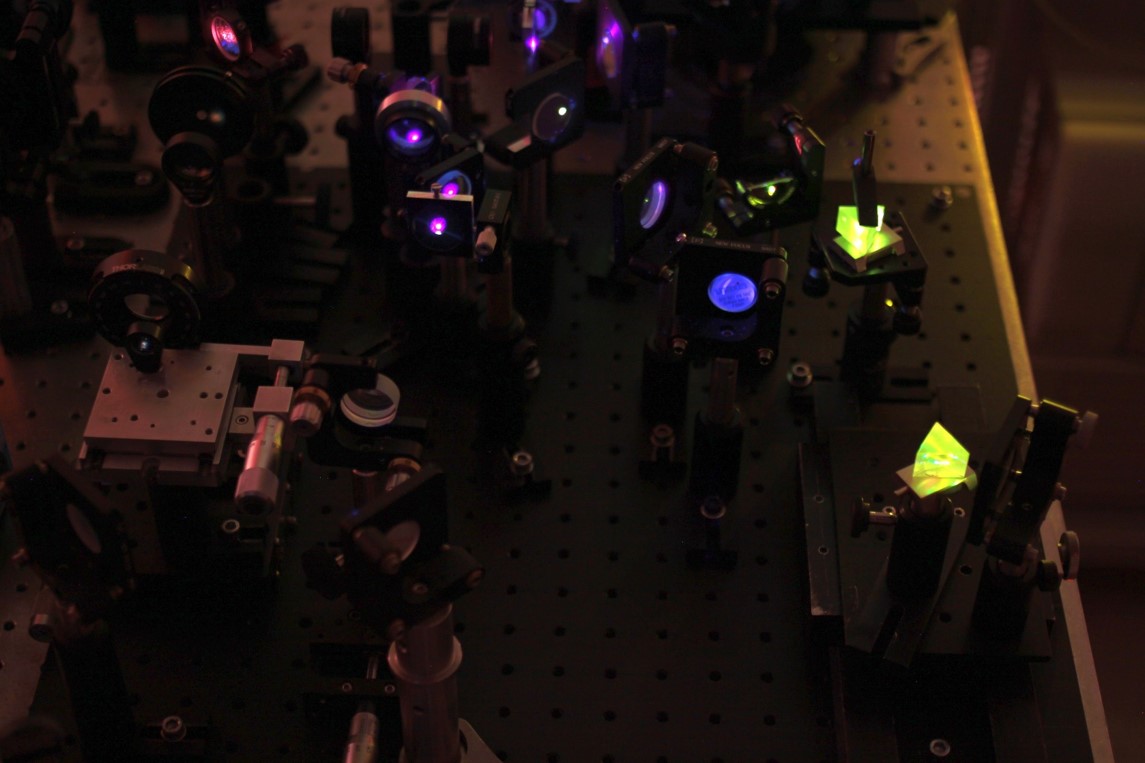
NOPA in action. The output wavelength was tuned to 550nm, hence the green emission from prisms in the pulse compressor positioned in the right part of the image.
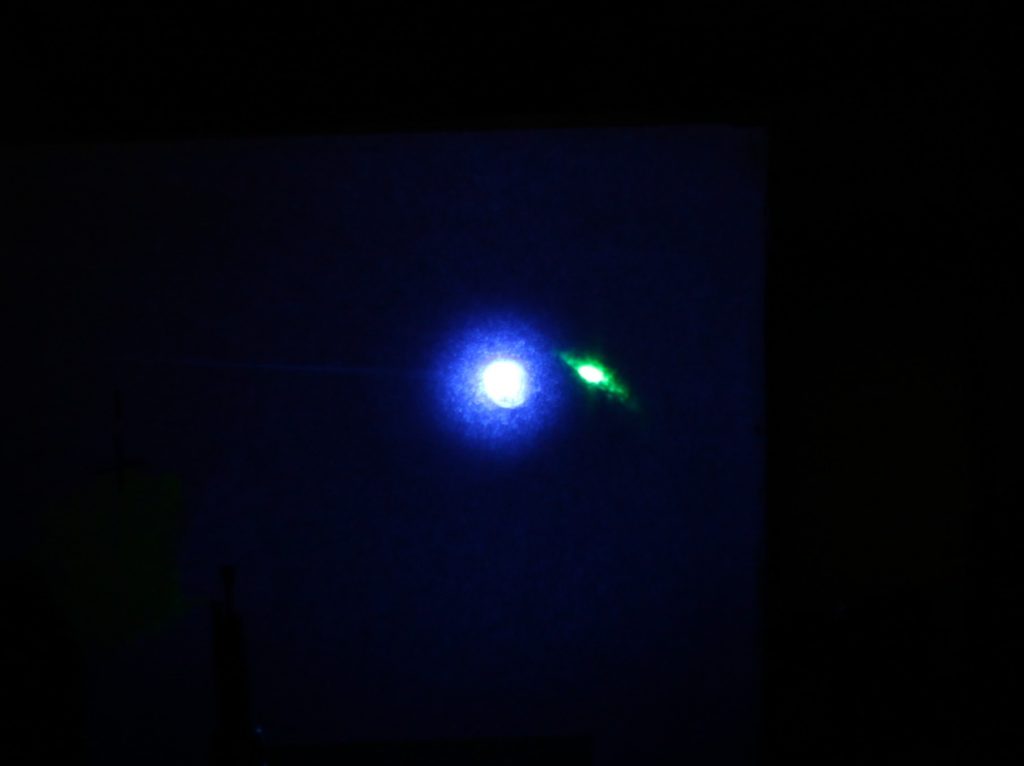
Image of the NOPA signal (green spot) after the BBO crystal where the SHG signal (blue spot) is overlapped in time and space with supercontinuum white light generated in by focusing small part of the fundamental beam (800nm) in 3mm thick sapphire plate
The pulses emerging from our NOPA were characterized using frequency resolved optical gating (FROG) exploiting sum frequency mixing of fundamental fs laser pulse at 800 nm and NOPA pulses.The results for 3 different NOPA wavelengths are shown in the following figure. Results suggest that measured bandwidths would support, with appropriate compression, pulses much shorter than the pump pulse from Spectra-Physics Spitfire (120fs @800nm) fs amplifier.
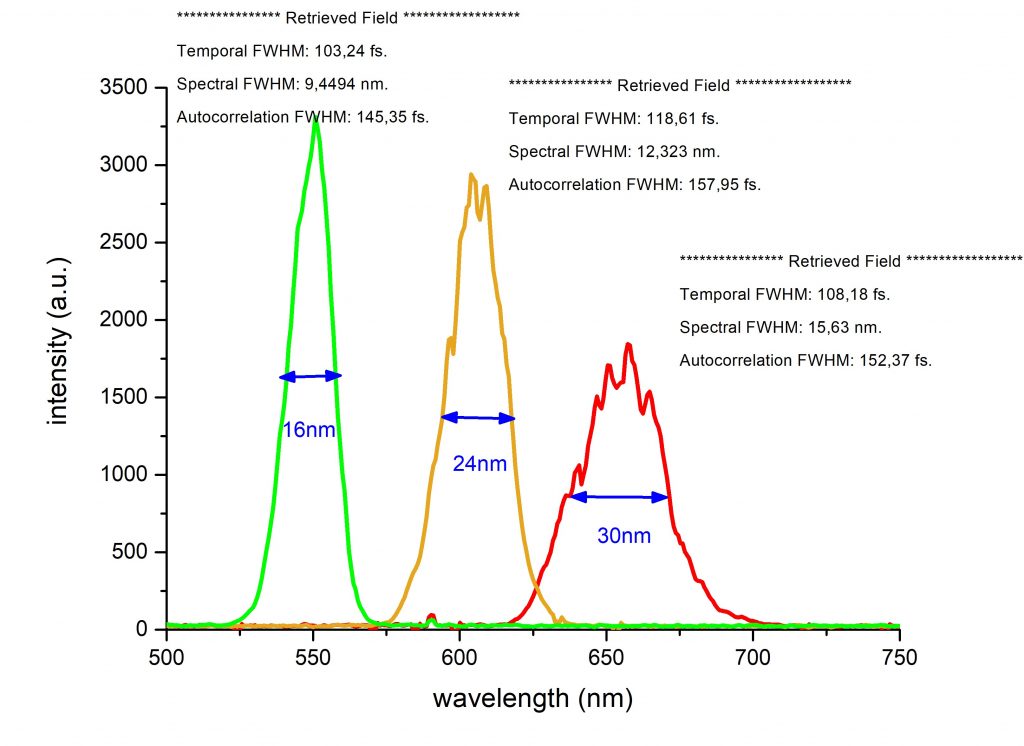
Characterization of NOPA output pulses using sum frequency generation (SFG) FROG technique
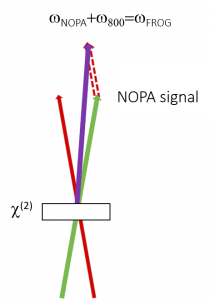
FROG signal (purple arrow) is obtained by sum frequency mixing of fundamental fs laser pulse at 800 nm and NOPA pulses.